
Weekly revenue
Weekly downloads
Rating
Price
Weekly revenue
Weekly downloads
Rating
Price
Subscribe to see revenue estimates, ads, complaints and keywords.
Launch offer: 50% off until October 31, 2026
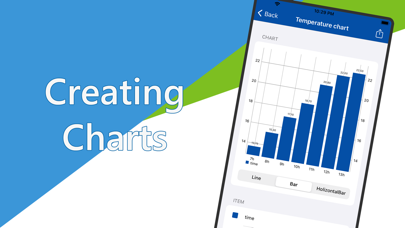
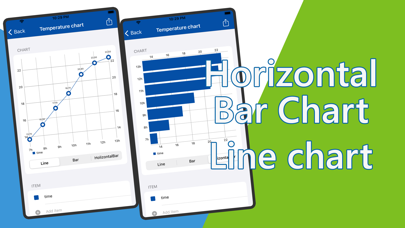
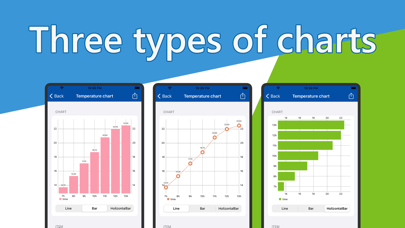
It is a tool application that can create bar graphs and line graphs. The created graph can be output as PDF / image You can use it freely, such as daily records and graphing store sales. You can use it like this ・ Daily body temperature record ・ Daily weight record ・ Graph the sales of the store ・ Creation of population transition table ・ Creating graphs to attach to school reports ・ Creation of statistical data Graph type ・ Line graph ・ bar graph ・ Horizontal bar graph The created image can be output as PDF or image. It can also be used to create images and PDFs for materials.
Not on the US charts right now.